By Scott Simmie
Flying a drone in congested urban centres is tricky.
Not only does the operator have to be aware of buildings, low-flying helicopters and people and property on the ground, but on many days there’s an unseen force at work that can cause havoc for safe RPAS flight: Wind. Specifically, the turbulence, wind tunnels and even wind shear that can be created when wind passes between and over buildings.
“Urban environments create a variety of exacerbated micro-level wind effects including shear, turbulence and eddies around buildings. These effects can locally increase reported wind speeds by up to 50 per cent,” says Dr. Eric Saczuk, InDro’s Flight Operations Lead and head of RPAS Operations at the BC Institute of Technology.
Routine drone flights in dense urban centres are clearly part of the future. That’s why a long-term study into how wind behaves in such settings has been underway, with funding from the Transport Canada RPAS Task Force (now absorbed into a broader Strategy and Emerging Technologies (SET) Branch and the National Research Council (NRC) Integrated Aerial Mobility Program. Now, a scientific research paper has been published on the preliminary findings – with more research to come.
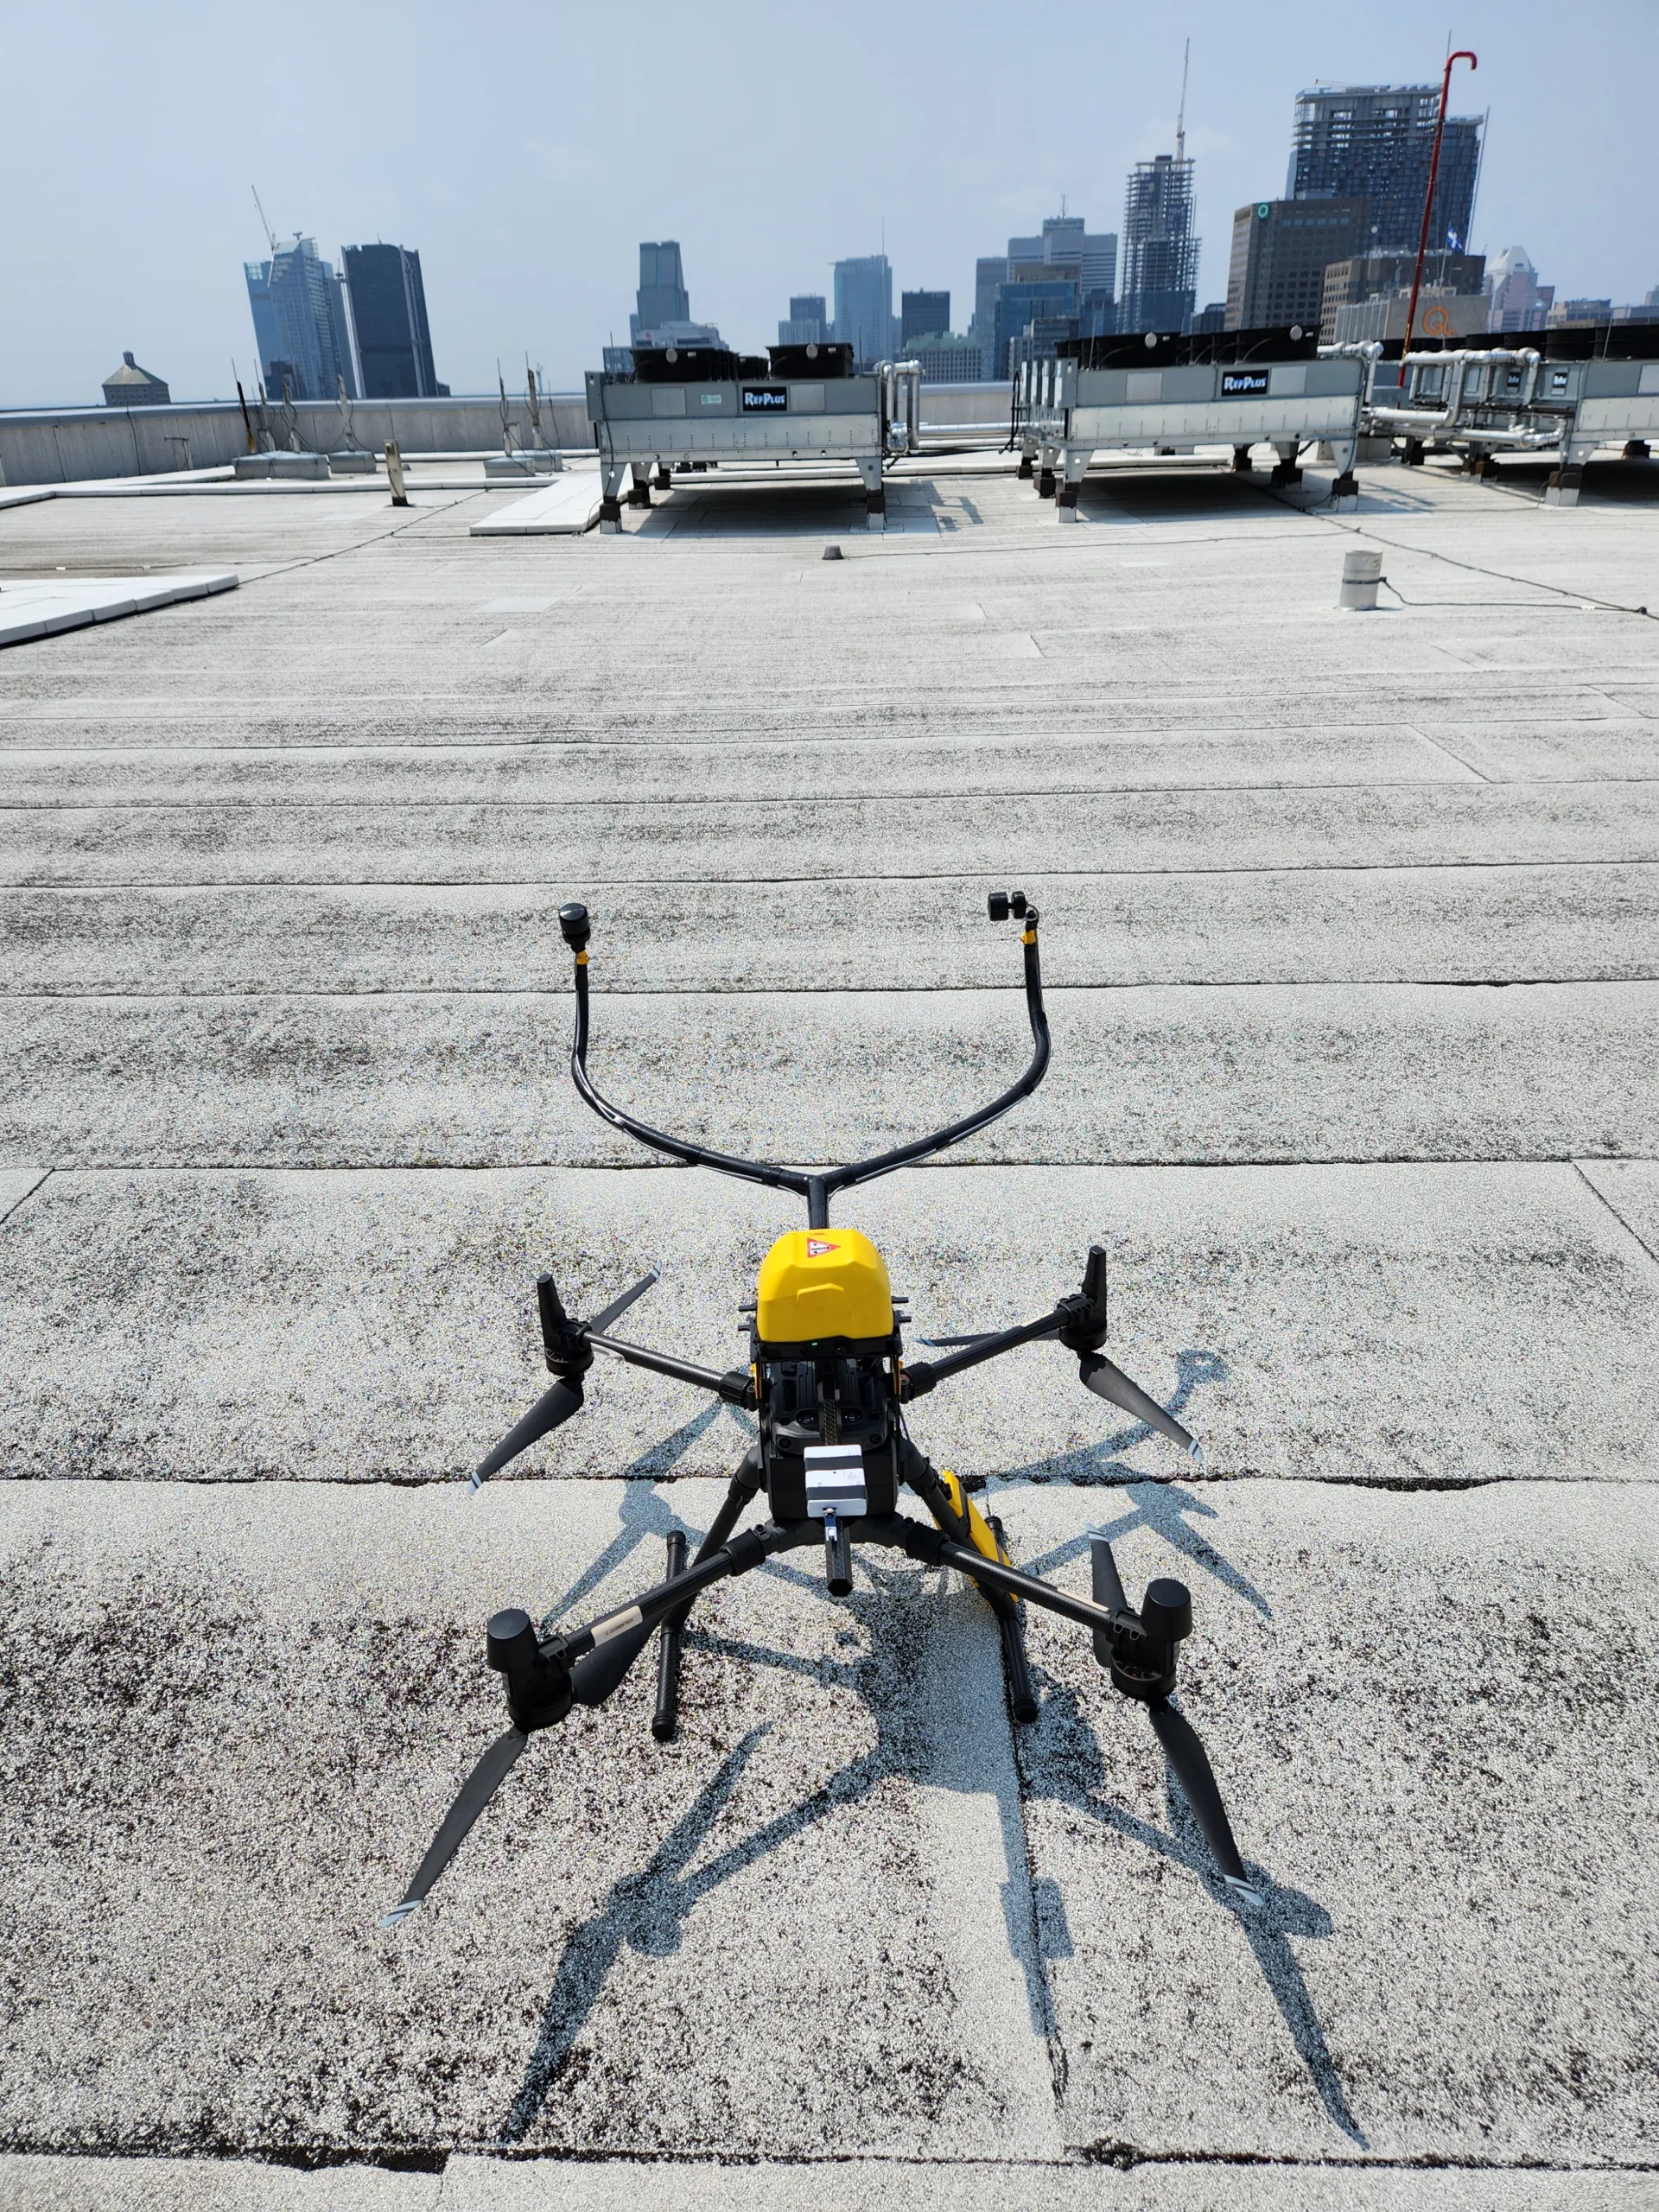
And the InDro connection? InDro Chief Pilot Dr. Saczuk has been overseeing these flights – with more to come on the immediate horizon. On previous missions, the drone was equipped with an AVSS parachute and a wishbone-like device that carried two precision sonic anemometers positioned to capture windspeed data from different angles. That georeferenced data determines not only the speed and turbulence of the wind, but also the precise direction (and changes in direction, including wind shear) as the drone passes over what could be called an urban wind canyon.
Below: A DJI M300 drone, equipped with additional sensors, during 2023 research. Anemometers are mounted on the end of that wishbone-like brace, with each positioned to capture wind data from different directions

THE RESEARCH – AND THE PAPER
The first phase of this ongoing project involved two very distinct procedures. One involved the drone flights, which included not only navigating wind-tunnel corridors in urban Montreal, but also hovering for periods at specific spots over and adjacent to buildings. Separate anemometers were affixed to the buildings themselves and the data was compared.
The second part took place in the NRC’s wind tunnel. There, a 1:300 scale model of the urban environment the drone flew in was assembled and placed in the tunnel. Measurements were made at various controlled windspeeds. The data from each was then compared for consistency.
The ultimate goal, for this phase of the research, is to be determine whether accurate predictive analytic models could be created that could be used when planning RPAS flights. The research might uncover, for instance, that general wind speeds within the flight parameters of a given RPAS might exceed those limits when passing around and over buildings, resulting in turbulence that would be unsafe for a mission to proceed. Such models will be immensely useful as urban RPAS flights become more routine.
But the first phase was simply to see if the data captured by the drone was in sync with the data produced in the wind tunnel testing.
“The goal of the overall study was to acquire urban-airflow data in a real environment in order to validate equivalent airflow characteristics from model-scale testing,” states the paper.
“The field test was designed to measure urban airflow characteristics using anemometers mounted on a small RPAS. The RPAS was flown along various flight paths in downtown Montréal in 2023. Following the field test, airflow measurements were taken at the equivalent spatial locations in a wind tunnel using a 1:300-scale model of the same test site. Data-processing routines for the RPAS airflow measurements included accounting for the body-motion of the vehicle and applying custom calibration equations for the RPAS-mounted sonic anemometers.”
THE RESULTS
The data obtained by the drone compared favourably with the scale-model tests carried out in the wind tunnel. In other words, the data indicates it may be possible to produce reliable, predictive models of various urban centres by testing scale models within the wind tunnel itself. Eventually, this research could potentially indicate specific locations in cities where turbulence is of particular concern for RPAS flights.
As the report states: “The distribution of mean flow speed and turbulence intensity from the field test compared well with the wind-tunnel results, including the shape of the distribution and location of the maxima. Additionally, the variation in flow characteristics along a flight path, such as mean flow speed and turbulence intensity, compared favourably with wind-tunnel results acquired at the same relative locations. This work demonstrates the suitability of model-scale testing for studying urban flow fields.”
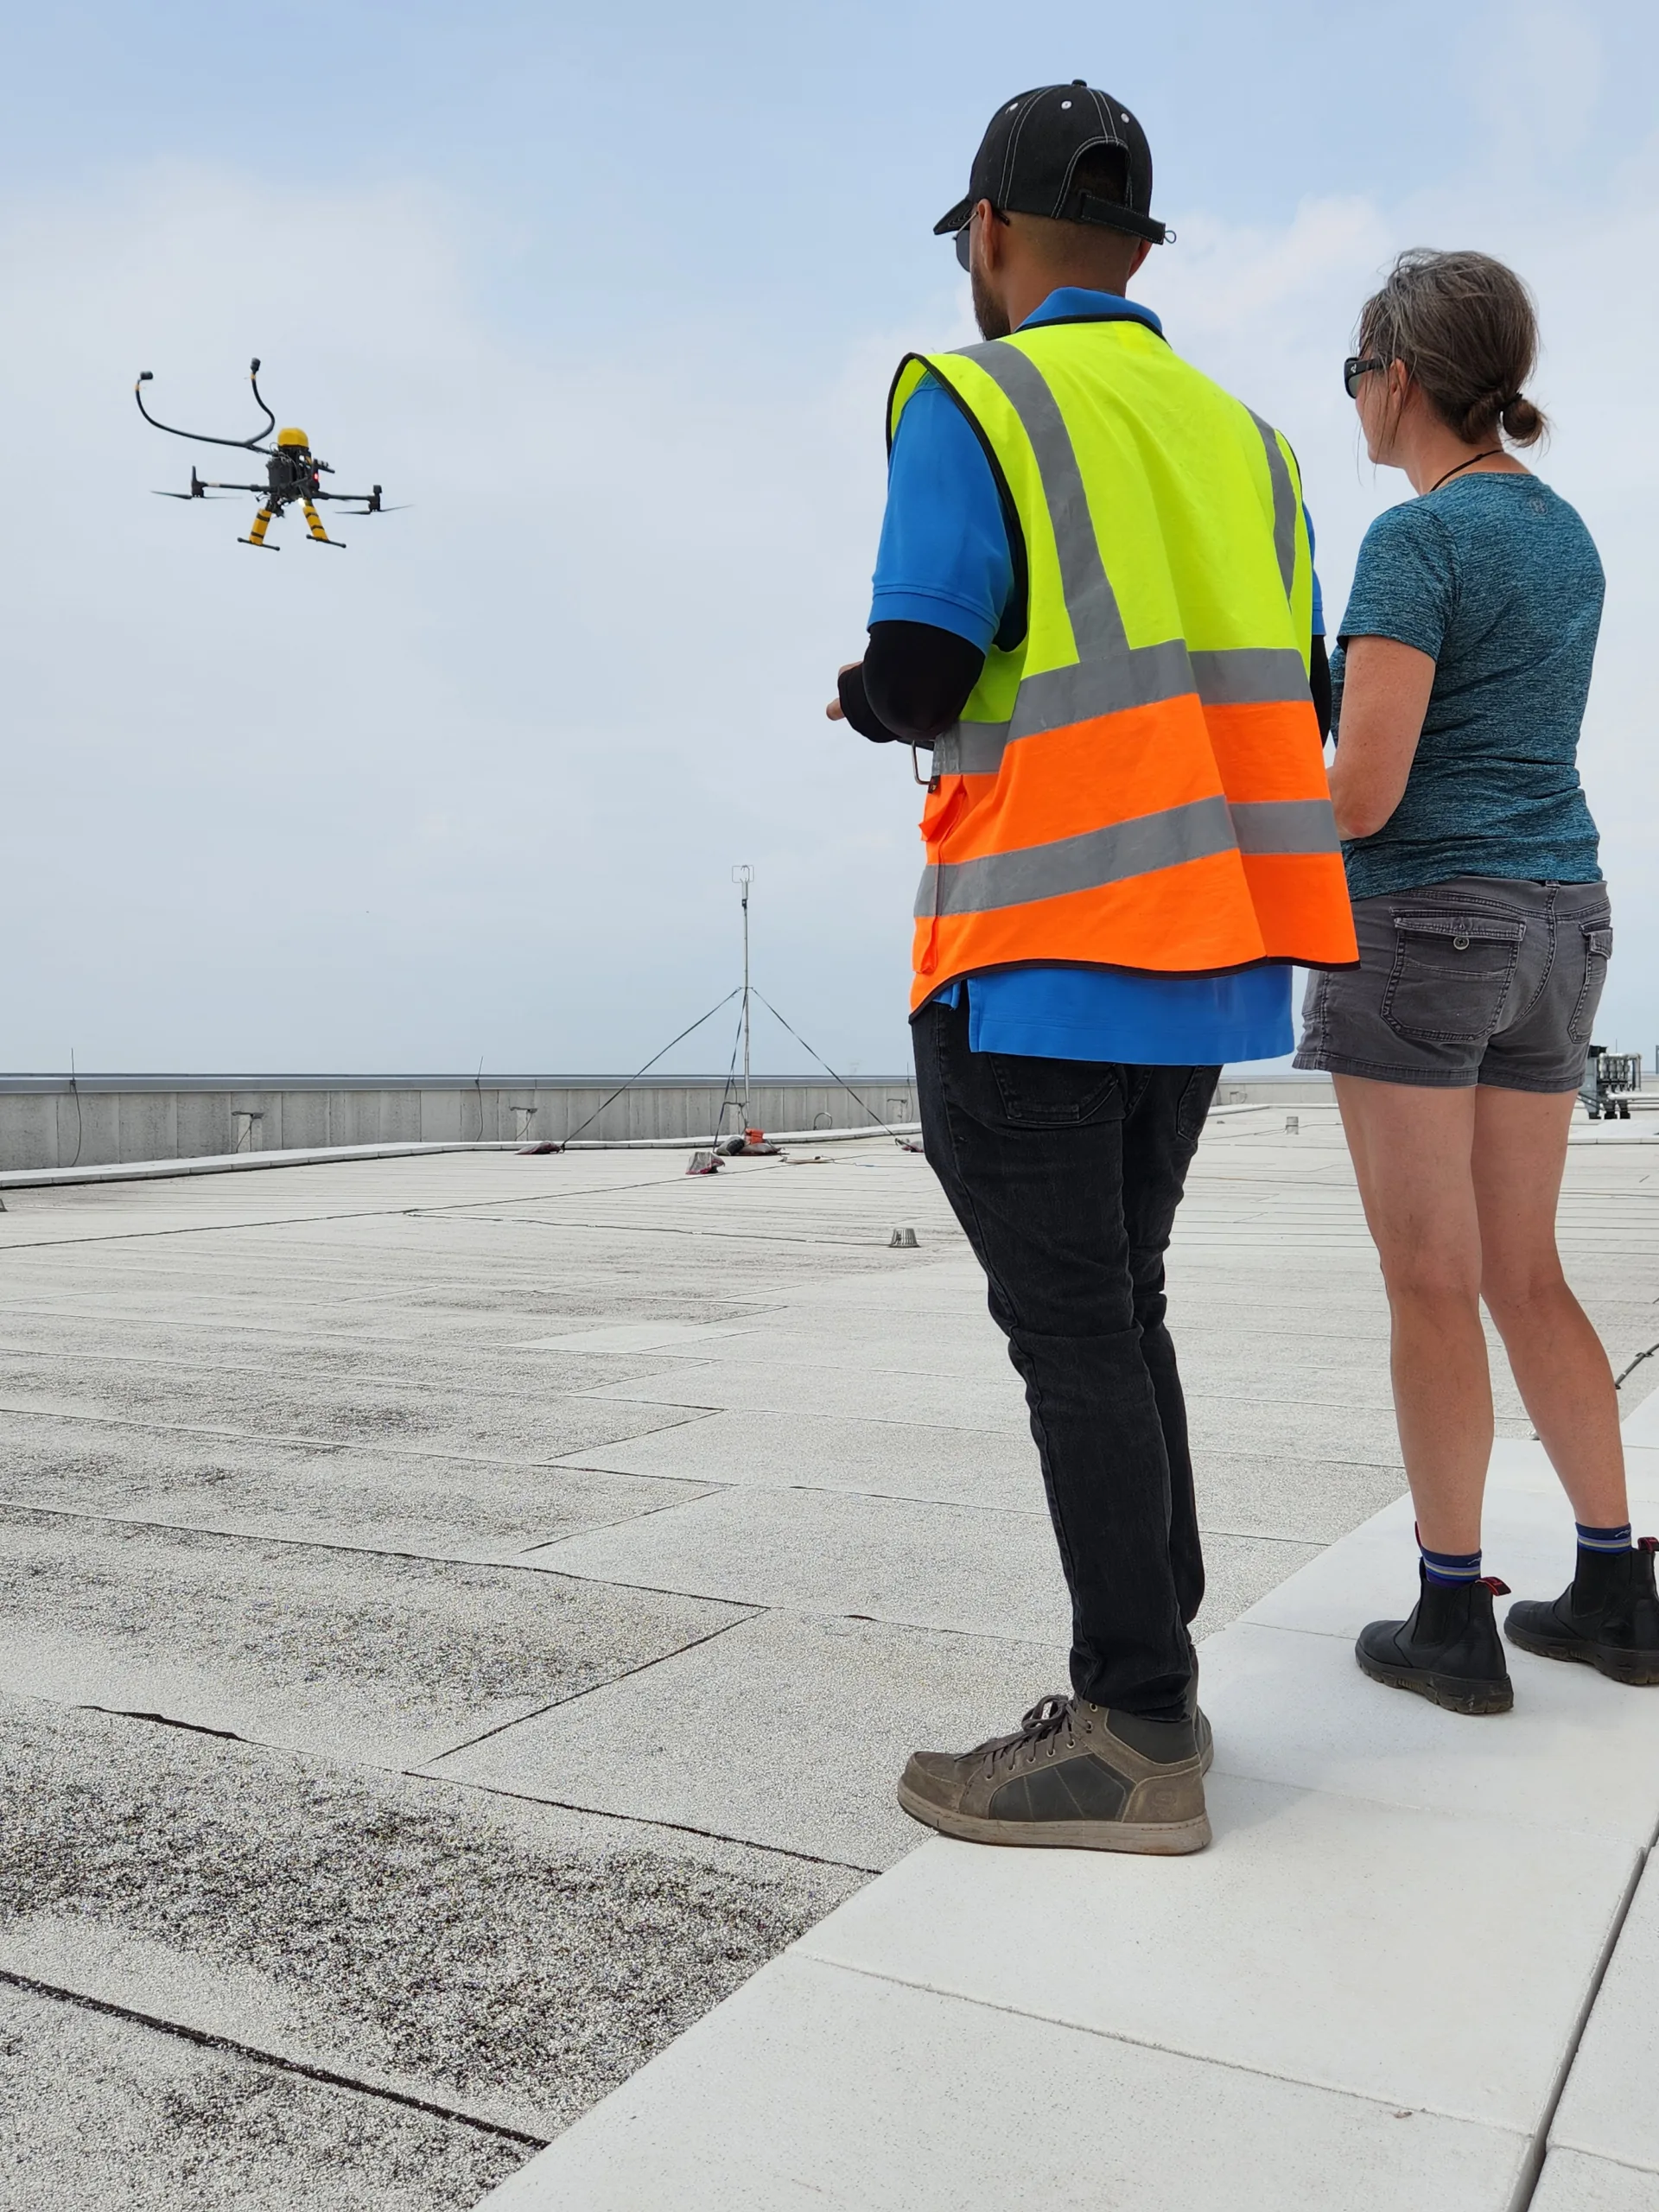
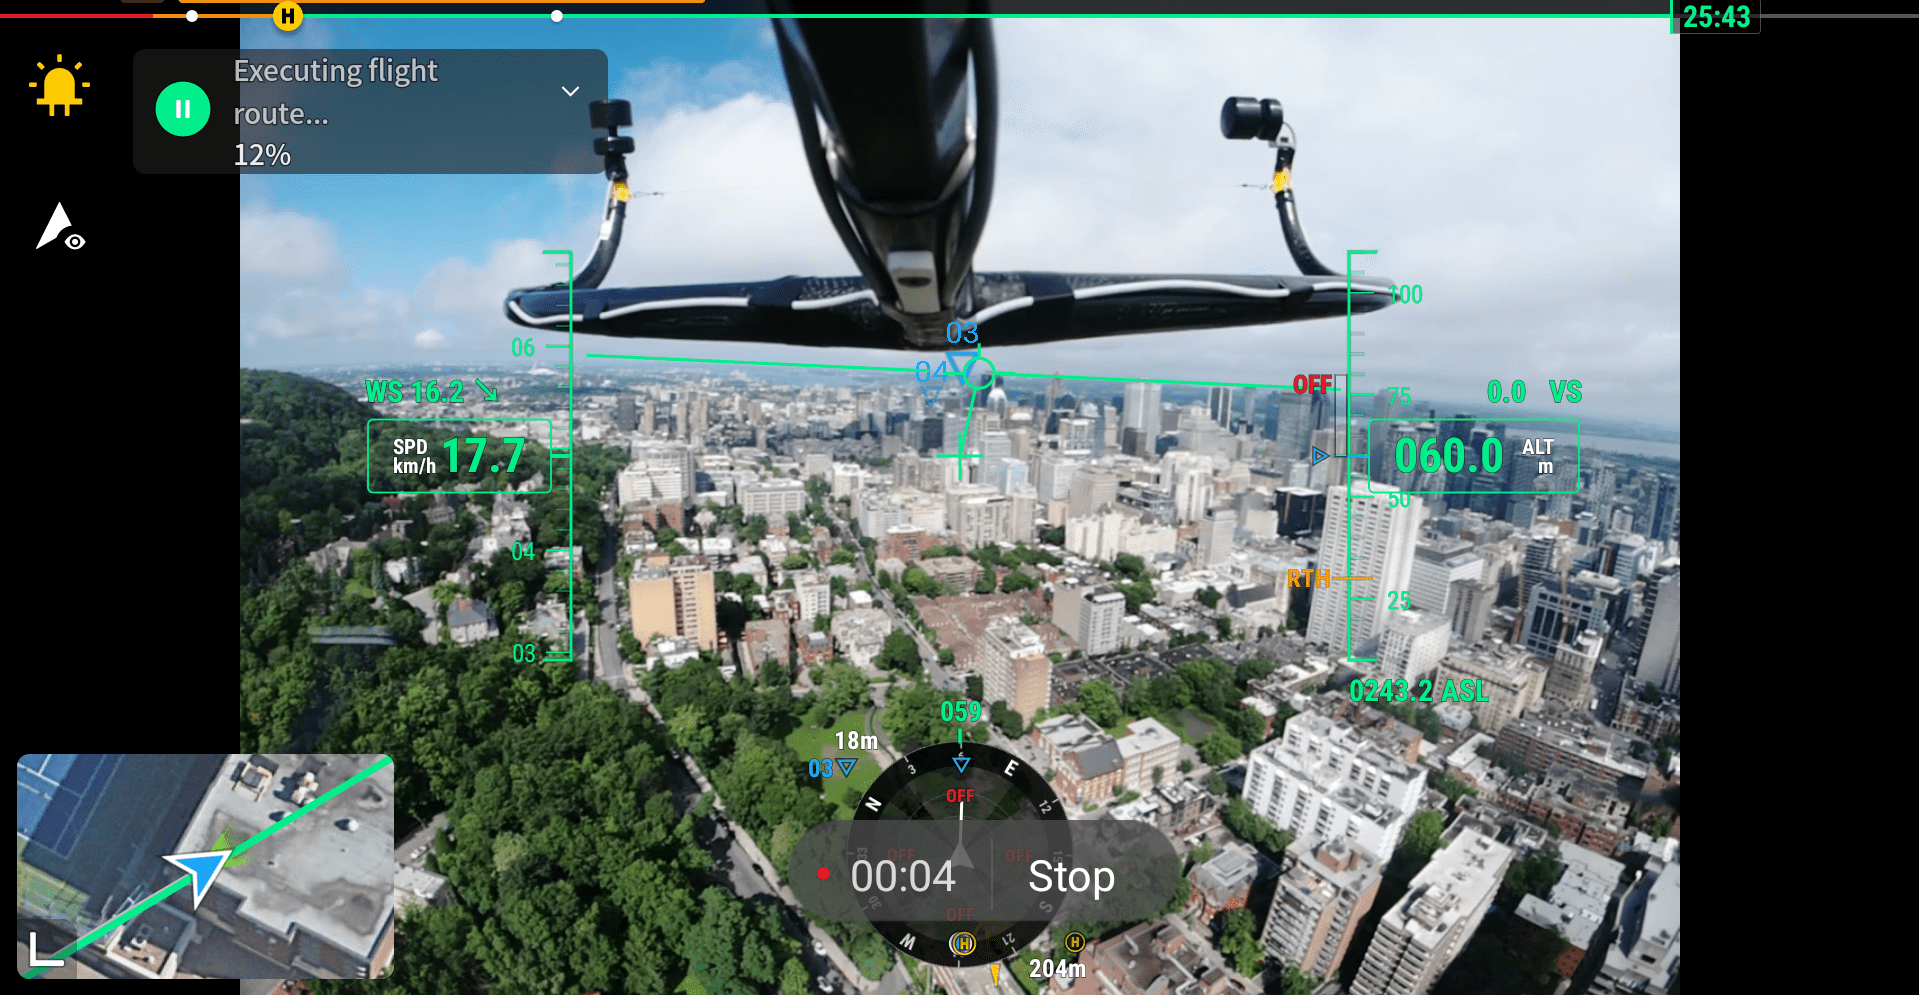
Below: Carrying out research flights in Montreal in the summer of 2023, followed by an in-flight screen capture


INDRO’S TAKE
This is complex research, and these are complex missions to fly. We are pleased to have other partners on board in this research, including McGill University, Place Ville Marie, Îlot Balmoral, Maison du Développement Durable, Hôpital général de Montréal, and the Centre Hospitalier de l’Université de Montréal.
“InDro is pleased to be part of this critical research, which will help ensure safe flights in turbulent urban environments – including models that may one day predict when and where it’s unsafe to carry out missions,” says InDro Founder and CEO Philip Reece. “Of course, there are other challenges flying in cities – including the potential impact of a constellation of RF signals that could interfere with C2 links. We look forward to the next phase of this project.”
This research is ongoing and we have more flights planned in Montreal later in September.
It’s also worth noting we have barely scratched the surface of this exhaustive research paper. For those interested in a more in-depth explanation – along with plenty of data visualisations – you’ll find it here. You can also check out our 2023 flight in this post.

